Cloudflare Workers OpenTelemetry: Cut Observability Costs 90%
Why Observability Is Hard at the Edge
In traditional server environments, you can log to files, attach APM agents as sidecars, and maintain context across long request lifecycles. Cloudflare Workers, however, is a completely different world.
Workers run in isolated V8 contexts with lifespans measured in milliseconds. There is no file system and no persistent background process. Debugging with console.log often leaves you stranded when a mysterious error strikes in production—leaving wrangler tail real-time logs as your only resort.
Starting in late 2024, Cloudflare began embedding native OpenTelemetry support directly into Workers. Now, with zero code modifications and just a few configuration lines in wrangler.jsonc, distributed traces for every fetch request, D1 query, KV read/write, and Durable Object call are collected automatically.
In this guide, you will learn how to enable native OTel auto-tracing, add custom spans, export data to Axiom and Honeycomb via OTLP, and apply sampling strategies to slash monthly observability costs by over 90%.
Key OpenTelemetry Concepts
Before diving into setup, let’s review three core OTel concepts.
Trace
 └── Span: A single unit of work
      ├── Span: D1 Query (Child Span)
      ├── Span: KV Read (Child Span)
      └── Span: External API Call (Child Span)

Each Span includes:
  - Start/End time
  - Duration
  - Attributes: Key-value metadata
  - Events: Timestamped log points
- Status: OK / Error- Trace: The full end-to-end journey of a single request passing through the system.
- Span: A single unit of work within a trace (such as a DB query or API call).
- OTLP: OpenTelemetry Protocol—the standard format for telemetry data transmission.
In Workers, a trace visualizes the entire execution sequence—from the incoming Workers request to D1 lookups and external API calls—in a single waterfall diagram.
Understanding Observability Cost Structure
Before configuring telemetry, you need to understand the cost structure. Configured incorrectly, trace ingestion costs can easily surpass your Workers execution bill.
| Component | Free Tier | Paid |
|---|---|---|
| Cloudflare Workers Dashboard Traces | 20M events/month | $0.60 per million over limit |
| Axiom Data Ingestion | 500GB/month | $1/GB over limit |
| Grafana Cloud Traces | 50GB/month | $0.55/GB over limit |
| Honeycomb | 20M events/month | ~$1 per million over limit |
The Core Issue: High-traffic Workers can handle hundreds of millions of requests per day. Collecting a trace for every single request causes event volume to explode.
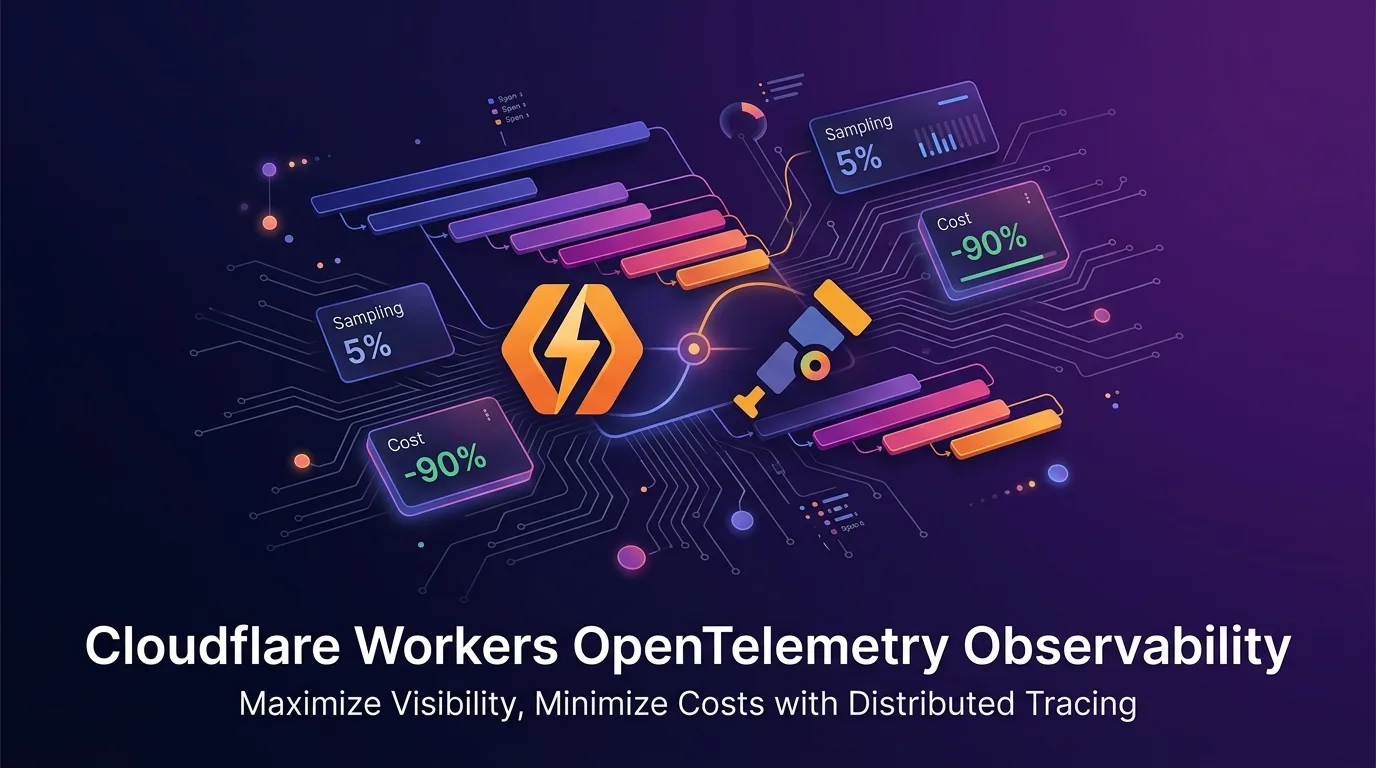
The Solution: Head Sampling. Sampling just 5% of overall requests cuts total events by 95% while retaining statistically meaningful insights. Combining this with 100% error capture preserves full debugging capabilities while slashing costs by 90%+.
Step 1: Enable Native Auto-Tracing
You can enable auto-tracing without changing any application code—simply update wrangler.jsonc.
// wrangler.jsonc
{
  "name": "my-worker",
  "main": "src/index.ts",
  "compatibility_date": "2025-01-01",
  "compatibility_flags": ["nodejs_compat"],

  "observability": {
    "traces": {
      "enabled": true,
      // Head Sampling: Sample 5% of total requests
      "head_sampling_rate": 0.05,
      // Retain in Cloudflare dashboard (7-day retention)
      "persist": true
    },
    "logs": {
      "enabled": true,
      "head_sampling_rate": 0.1
    }
  },

  "d1_databases": [
    {
      "binding": "DB",
      "database_name": "my-db",
      "database_id": "xxxxxxxx-xxxx-xxxx-xxxx-xxxxxxxxxxxx"
    }
  ],
  "kv_namespaces": [
    {
      "binding": "CACHE",
      "id": "xxxxxxxxxxxxxxxxxxxxxxxxxxxxxxxx"
    }
  ]
}
With this configuration alone, the following are automatically traced:
- All
fetch()handler entry points - D1 database queries (including raw SQL statements)
- KV read/write operations
- R2 object storage operations
- Durable Object invocations
- Outbound
fetch()HTTP requests - Queue consumers and producers
Once you run wrangler deploy, traces appear immediately under Cloudflare Dashboard → Workers → Observability.
Step 2: Trace Application Logic with Custom Spans
While native auto-tracing covers platform operations, internal business logic requires custom spans.
New in 2025: cloudflare:workers Native Tracing API
// src/index.ts
import { tracing } from "cloudflare:workers";
import { Hono } from "hono";
import { drizzle } from "drizzle-orm/d1";
import { users, posts } from "./db/schema";

type Env = {
  DB: D1Database;
  CACHE: KVNamespace;
};

const app = new Hono<{ Bindings: Env }>();

app.get("/api/posts/:slug", async (c) => {
  const slug = c.req.param("slug");

  // Custom span: Wrap post fetching logic into a single span
  return tracing.enterSpan("get-post-by-slug", async (span) => {
    // Add business context attributes to the span
    span.setAttribute("post.slug", slug);
    span.setAttribute("app.feature", "blog");

    const db = drizzle(c.env.DB);

    // KV cache lookup (automatically generates a child span)
    const cacheKey = `post:${slug}`;
    const cached = await c.env.CACHE.get(cacheKey, "json");

    if (cached) {
      span.setAttribute("cache.hit", true);
      // Span event: Record a specific timestamped point
      span.addEvent("cache-hit", { key: cacheKey });
      return c.json(cached);
    }

    span.setAttribute("cache.hit", false);

    // D1 lookup (automatically generates a child span containing SQL statements)
    const post = await db
      .select()
      .from(posts)
      .where(eq(posts.slug, slug))
      .get();

    if (!post) {
      // Record error status
      span.setStatus({ code: "ERROR", message: "Post not found" });
      return c.json({ error: "Not found" }, 404);
    }

    span.setAttribute("post.id", post.id);
    span.setAttribute("post.published", post.published);

    // KV caching (fire-and-forget)
    c.executionCtx.waitUntil(
      c.env.CACHE.put(cacheKey, JSON.stringify(post), {
        expirationTtl: 300,
      })
    );

    return c.json(post);
  });
});

export default app;
Nested Spans: Tracing Complex Workflows
// Complex business logic with multiple stages
async function processOrder(
  env: Env,
  ctx: ExecutionContext,
  orderId: string
) {
  return tracing.enterSpan("process-order", async (orderSpan) => {
    orderSpan.setAttribute("order.id", orderId);

    // Stage 1: Check Inventory
    const inventory = await tracing.enterSpan(
      "check-inventory",
      async (span) => {
        span.setAttribute("order.id", orderId);
        const db = drizzle(env.DB);
        return db.select().from(inventoryTable)
          .where(eq(inventoryTable.orderId, orderId))
          .get();
      }
    );

    if (!inventory || inventory.stock < 1) {
      orderSpan.setStatus({
        code: "ERROR",
        message: "Out of stock",
      });
      throw new Error("Out of stock");
    }

    // Stage 2: Process Payment (External API)
    const payment = await tracing.enterSpan(
      "process-payment",
      async (span) => {
        span.setAttribute("payment.provider", "stripe");
        // Outbound fetch automatically creates a span
        const res = await fetch("https://api.stripe.com/v1/charges", {
          method: "POST",
          // ...
        });
        span.setAttribute("payment.status", res.status);
        return res.json();
      }
    );

    orderSpan.setAttribute("payment.id", payment.id);
    orderSpan.addEvent("order-completed", {
      orderId,
      paymentId: payment.id,
    });

    return payment;
  });
}
tracing.enterSpan() automatically closes the span when the callback returns or the promise resolves. You never need to invoke span.end() manually.
Step 3: Integrate External OTLP Dashboards
To overcome the Cloudflare Dashboard’s 7-day retention limit, export telemetry to external OTLP endpoints.
Axiom Integration (Free 500GB/month)
// Add destinations to wrangler.jsonc
{
  "observability": {
    "traces": {
      "enabled": true,
      "head_sampling_rate": 0.05,
      "persist": false,  // Disable Cloudflare dashboard storage
      "destinations": ["axiom-traces"]
    },
    "logs": {
      "enabled": true,
      "head_sampling_rate": 0.1,
      "destinations": ["axiom-logs"]
    }
  }
}
Adding a Destination in the Cloudflare Dashboard:
- Workers → Observability → Destinations → Add Destination
- Name:
axiom-traces - Type:
OTLP - Endpoint:
https://api.axiom.co/v1/traces - Headers:
Authorization: Bearer <AXIOM_API_TOKEN>,X-Axiom-Dataset: my-workers
Honeycomb Integration
Endpoint: https://api.honeycomb.io/v1/traces
Headers:
  x-honeycomb-team: <HONEYCOMB_API_KEY>
  x-honeycomb-dataset: cloudflare-workers
Grafana Cloud Integration
Endpoint: https://otlp-gateway-prod-<region>.grafana.net/otlp/v1/traces
Headers:
  Authorization: Basic <base64(instanceId:apiToken)>
@microlabs/otel-cf-workers: Code-Level Customization
If native OTel is insufficient and you require finer control:
// src/index.ts — Using @microlabs/otel-cf-workers
import { instrument, ResolveConfigFn } from "@microlabs/otel-cf-workers";
import { trace, context } from "@opentelemetry/api";

type Env = {
  DB: D1Database;
  OTEL_EXPORTER_OTLP_ENDPOINT: string;
  OTEL_EXPORTER_OTLP_HEADERS: string;
};

const handler = {
  async fetch(request: Request, env: Env, ctx: ExecutionContext) {
    const tracer = trace.getTracer("my-worker");

    return tracer.startActiveSpan("handle-request", async (span) => {
      try {
        span.setAttribute("http.method", request.method);
        span.setAttribute("http.url", request.url);

        const url = new URL(request.url);
        const response = await routeRequest(request, env, ctx);

        span.setAttribute("http.status_code", response.status);
        return response;
      } catch (err) {
        span.recordException(err as Error);
        span.setStatus({ code: SpanStatusCode.ERROR });
        throw err;
      } finally {
        span.end();
      }
    });
  },
};

// Read OTLP settings from environment variables
const config: ResolveConfigFn = (env: Env, trigger) => ({
  exporter: {
    url: env.OTEL_EXPORTER_OTLP_ENDPOINT,
    headers: Object.fromEntries(
      new URLSearchParams(env.OTEL_EXPORTER_OTLP_HEADERS)
    ),
  },
  service: {
    name: "my-cloudflare-worker",
    version: "1.0.0",
  },
});

export default instrument(handler, config);
Step 4: Sampling Strategies — The Key to 90% Cost Reduction
Sampling isn’t just about dropping numbers across the board. The true key lies in sampling normal requests while capturing 100% of errors.
Head Sampling
Decides whether to trace at the moment a request arrives. This approach is simple and introduces minimal performance overhead.
{
  "observability": {
    "traces": {
      "enabled": true,
      "head_sampling_rate": 0.05  // 5% sampling
    }
  }
}Drawback: Requests containing errors also have a 95% chance of being dropped.
Tail Sampling: Retain 100% of Errors
Using @microlabs/otel-cf-workers alongside a custom sampler enables tail sampling logic:
// src/sampling.ts — Sample 100% of errors, 5% of normal requests
import { Sampler, SamplingResult, SamplingDecision } from "@opentelemetry/sdk-trace-base";

export class ErrorAlwaysSampler implements Sampler {
  private baseRate: number;

  constructor(baseRate = 0.05) {
    this.baseRate = baseRate;
  }

  shouldSample(
    context: any,
    traceId: string,
    spanName: string,
    spanKind: any,
    attributes: any,
    links: any
  ): SamplingResult {
    // Always sample HTTP error statuses
    const statusCode = attributes["http.status_code"];
    if (statusCode && statusCode >= 400) {
      return { decision: SamplingDecision.RECORD_AND_SAMPLED };
    }

    // Always sample if error attribute exists
    if (attributes["error"] === true) {
      return { decision: SamplingDecision.RECORD_AND_SAMPLED };
    }

    // Sample remaining requests based on baseRate
    return {
      decision:
        Math.random() < this.baseRate
          ? SamplingDecision.RECORD_AND_SAMPLED
          : SamplingDecision.NOT_RECORD,
    };
  }

  toString() {
    return `ErrorAlwaysSampler(${this.baseRate})`;
  }
}
// Apply custom sampler to instrument configuration
const config: ResolveConfigFn = (env: Env) => ({
exporter: { url: env.OTEL_ENDPOINT },
service: { name: "my-worker" },
sampler: new ErrorAlwaysSampler(0.05),
});Cost Simulation by Sampling Rate
Assuming a Worker handles 1 billion requests per month:
| Sampling Rate | Monthly Events | Axiom Cost | Honeycomb Cost |
|---|---|---|---|
| 100% (No sampling) | 1B | ~$500/mo | ~$1,000/mo |
| 10% | 100M | ~$50/mo | ~$100/mo |
| 5% | 50M | ~$25/mo | ~$50/mo |
| 1% | 10M | Free | ~$10/mo |
A 5% sampling rate cuts costs by 95% while delivering thousands of statistically representative samples per second.
Step 5: Utilizing Traces — Production Use Cases
Identifying Slow D1 Queries
Run this APL query in Axiom to detect D1 queries taking longer than 100ms:
// Axiom APL Query
['cloudflare-workers']
| where ['span.kind'] == "client"
| where ['db.system'] == "cloudflare.d1"
| where duration > 100ms
| summarize count(), avg(duration) by ['db.statement']
| order by avg_duration desc
| limit 20
Analyzing Error Patterns
// Filter traces with 5xx error responses
['cloudflare-workers']
| where ['http.status_code'] >= 500
| where ['span.is_root'] == true
| project _time, ['http.url'], ['http.method'], duration, ['error.message']
| order by _time desc
Tracking P99 Latency
// P50/P95/P99 latency breakdown for a specific endpoint
['cloudflare-workers']
| where ['http.route'] == "/api/posts/:slug"
| summarize
    p50 = percentile(duration, 50),
    p95 = percentile(duration, 95),
    p99 = percentile(duration, 99)
    by bin(_time, 5m)
| order by _time desc
Step 6: Tracing Durable Objects
Durable Objects have a more complex lifecycle than Workers, requiring specific tracing considerations.
Native Auto-Tracing (Recommended)
Simply setting observability.traces.enabled = true in wrangler.jsonc connects DO invocations as child spans under the parent Worker trace—no @microlabs/otel-cf-workers needed.
Worker Request Trace
  └── fetch handler (root span)
       ├── D1 Query (Auto Span)
       └── Durable Object Call (Auto Child Span)
            ├── DO fetch handler
            └── DO internal D1 Query
@microlabs/otel-cf-workers: Manual DO Instrumentation
// src/rate-limiter.ts — Durable Object with OTel
import { instrumentDO } from "@microlabs/otel-cf-workers";
import { trace } from "@opentelemetry/api";

class RateLimiterBase {
  private state: DurableObjectState;

  constructor(state: DurableObjectState, env: Env) {
    this.state = state;
  }

  async fetch(request: Request): Promise<Response> {
    const tracer = trace.getTracer("rate-limiter-do");

    return tracer.startActiveSpan("rate-limit-check", async (span) => {
      const key = new URL(request.url).searchParams.get("key") ?? "global";
      span.setAttribute("rate_limit.key", key);

      const count = (await this.state.storage.get<number>(key)) ?? 0;
      const limit = 100;

      if (count >= limit) {
        span.setAttribute("rate_limit.exceeded", true);
        span.setStatus({ code: "ERROR", message: "Rate limit exceeded" });
        span.end();
        return new Response("Rate limited", { status: 429 });
      }

      await this.state.storage.put(key, count + 1);
      span.setAttribute("rate_limit.count", count + 1);
      span.end();
      return new Response("OK");
    });
  }
}

// Wrap Durable Object class with OTel
export const RateLimiter = instrumentDO(RateLimiterBase, config);
Step 7: CI/CD and Alerting Integration
Automated Post-Deployment Verification with GitHub Actions
# .github/workflows/deploy.yml
- name: Deploy Worker
  run: npx wrangler deploy

- name: Verify Observability (Check post-deployment trace ingestion)
  run: |
    sleep 30  # Wait for trace collection
    # Query Axiom API for recent 5-minute error count
    ERRORS=$(curl -s "https://api.axiom.co/v1/datasets/my-workers/query" \
      -H "Authorization: Bearer $AXIOM_TOKEN" \
      -d '{"apl":"[\"my-workers\"] | where status >= 500 | where _time > ago(5m) | count"}' \
      | jq '.matches[0].data._count // 0')

    if [ "$ERRORS" -gt "10" ]; then
      echo "❌ Error spike detected post-deployment: $ERRORS errors in 5min"
      exit 1
    fi
    echo "✅ Post-deployment error count normal: $ERRORS"
Setting Alerts in Axiom
Send Slack alerts via Axiom Monitor when P99 latency breaches limits:
{
  "name": "Workers P99 Latency Alert",
  "query": {
    "apl": "['my-workers'] | where ['span.is_root'] == true | summarize p99 = percentile(duration, 99) by bin(_time, 1m) | where p99 > 2000ms"
  },
  "frequencyMinutes": 5,
  "durationMinutes": 5,
  "notifiers": ["slack-webhook"]
}
Vendor Selection Guide
| Use Case | Recommended Vendor | Rationale |
|---|---|---|
| Early-stage startup, cost conscious | Axiom | Free 500GB/mo, unified logs + traces |
| Already using Grafana stack | Grafana Cloud | Integrates with existing dashboards, free 50GB |
| Complex query & analysis needs | Honeycomb | BubbleUp anomaly detection, advanced querying |
| On-premise / compliance requirements | SigNoz (Self-hosted) | Open source, Kubernetes deployment |
| Basic log viewing only | Cloudflare Dashboard | Free, zero setup required |
Cost Optimization Checklist
Optimizations to apply in production:
Sampling Strategy:
-
head_sampling_rate: 0.05(Sample 5% of healthy requests) - Sample 100% of errors (Custom sampler)
- Sample 100% of slow requests (>1s)
Data Reduction:
- Strip unneeded attributes (PII, large payloads)
- Limit span name cardinality (Normalize URL parameters)
- Set
persist: falseto prevent duplicate Cloudflare dashboard storage
Cost Monitoring:
- Set monthly event volume alerts in vendor dashboard
- Audit weekly request counts in Cloudflare Workers Analytics
- Dynamically adjust sampling rates as traffic scales
Migration Path: From wrangler tail to OpenTelemetry
If you currently rely solely on wrangler tail and console.log, transition step-by-step:
Week 1: Add observability.traces.enabled: true to wrangler.jsonc and inspect traces in Cloudflare Dashboard
Week 2: Add Axiom Destination to leverage free 30-day retention
Week 3: Instrument core business logic using custom spans
Week 4: Tune sampling rates and set up alert rules
You don’t need to delete existing console.log statements. Worker logs can be exported alongside traces using observability.logs.enabled: true.
Conclusion
Cloudflare Workers OpenTelemetry support has matured rapidly since late 2024. Native auto-tracing instruments all platform operations without touching application code, while cloudflare:workers’ tracing.enterSpan() API allows fine-grained instrumentation of business logic.
Observability costs remain fully controllable through sampling:
- 5% Head Sampling: Cut costs by 95% while maintaining statistical visibility
- 100% Error Capture: Zero loss in debugging capability
- Axiom Free 500GB: Free tier covers medium-scale production workloads
Transforming edge functions from black boxes into fully observable distributed systems takes less than a minute—just 5 lines added to your wrangler.jsonc.
Related post: Check out Cloudflare Workflows and Durable Execution AI Agents to learn state management patterns for Durable Objects.